
Territories balanced on account potential, on one map
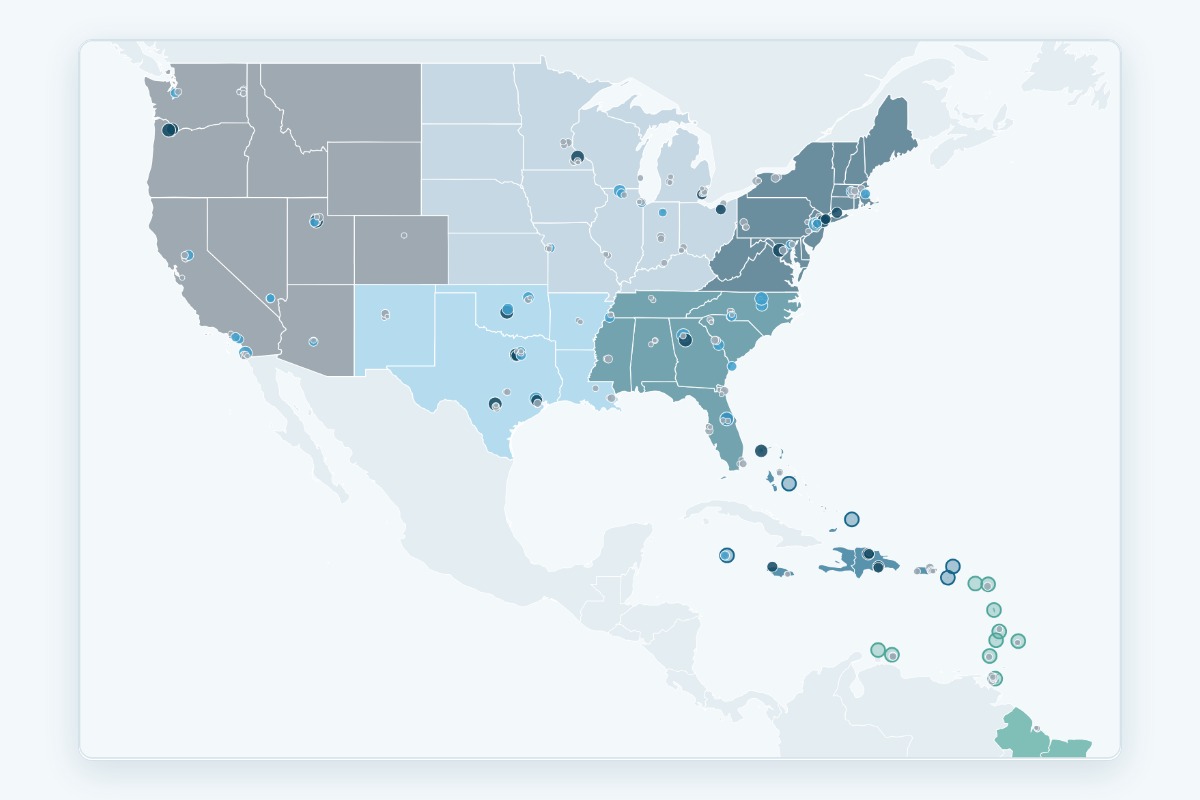
Accounts are plotted across US states and Caribbean markets, coloured by territory and sized by potential.
Territories drift while accounts change
New accounts arrive, reps leave, regions grow. Within a year one rep carries twice the potential of another with the same quota, and nobody can see it in a list view.
Every account on one map, with load per rep
Accounts are plotted across US states and Caribbean markets, coloured by territory and sized by potential. Load compares each territory's share of potential with its rep's share of quota. Paint regions into a territory, or ask for a suggested rebalance, review the moves and apply them. Owners, targets and coverage update across the workspace.
- US states and Caribbean markets in one view
- Dots by tier, stage, enrichment status or fit
- Load index per territory against quota
- Suggested rebalancing you review before applying
- Changes flow into planning and pipeline views
Watch it run
Viewing, balancing and reassigning territories. Demo workspace, fictional data.
Included from the Growth plan
See every plan and what it includes, priced per HubSpot portal.